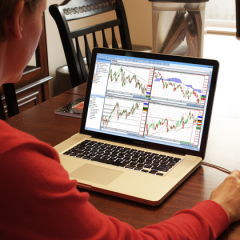
TrendnTrade (TNT) is a tool to help you with your end-of-day trading. It gives the private investor full access to the stock market, single stocks and the futures market.
Flexible and Fast
TnT is the best technical and fundamental analysis software on the market. You can look at charts, run daily scans for new stock picks or build a complete automated trading solution.
Save Time
TnT allows you to scan the market for opportunities in minutes saving you time. You can automate and fine tune your systems and remove emotions (fear and greed) from your trading.
Simulate Strategies
Test your strategy on historical data without risking your money. You’ll get buy and sell signals based on the trading system that best matched that stock.
Clear Charts
Charting is the most integral and visible component of TnT. Indicators and line studies can be plotted on a chart enabling you to visually analyse performance.
Charting Styles
TnT gives you four of the most widely-used price charting styles to choose from. You can customise the price plot’s appearance, including style, colour and line thickness
Templates and Layouts
Apply the same set of indicators and line studies to different stocks using chart templates. Layouts enable you to conveniently manage groups of charts.
Indicator Library
TnT comes with all the most popular indicators, and many of less known ones, with a full description on what each indicator does and how to apply it. You can import new indicators or even write your own!
Over 70 Line Studies
Line studies are placed using menu bars that float freely or can be docked on the side of your screen. The line studies available include Trend lines, Fibonacci lines, Regression channels, Cycles and many more.